How we visualised the ownership and control of state-owned enterprises using Open Ownership tools
State-owned enterprises (SOEs) play a critical part in the global economy – especially in the extractive sector – and are meant to be run for the benefit of the public.
Transparency about the unique and complex ways that SOEs are often governed is crucial. Not having reliable, up-to-date data on how they are owned and controlled constitutes a considerable weakness that could undermine the specific aims of beneficial ownership transparency reforms.
To look deeper into this, we have recently published technical guidance on defining and capturing data on the ownership and control of state-owned enterprises as part of our Opening Extractives programme, which is implemented jointly between the Extractive Industries Transparency Initiative (EITI) International Secretariat and Open Ownership.
Find the full technical guidance here.
In this blog post, we’ll explain how we used Open Ownership’s open source technology tools to convert publicly available information on two SOEs into structured data in line with our Beneficial Ownership Data Standard (BODS).
The purpose of exploring this in the guidance was both to learn more about the nuances of SOE ownership or control structures, and to demonstrate how to capture high-quality structured data by taking advantage of the latest features of BODS.
In the examples considered in the guidance, publicly available information on two SOEs – Nigeria LPG Limited and PT Pertamina from Indonesia – was taken from annual reporting documents, combined with other public sources, and structured in line with BODS using Open Ownership’s data generator tool. This spreadsheet template allows anyone to convert ownership or control information into data structured in line with version 0.3 of BODS.
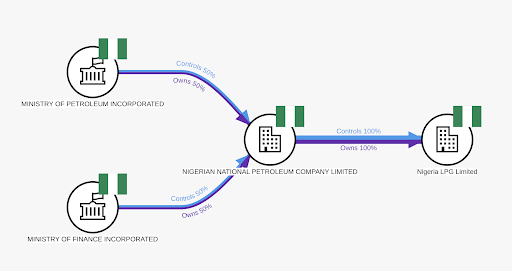
Once the information was added to the data generator, the spreadsheets were submitted to our data review tool for validation and conversion to BODS data. The data files produced were finally submitted to another tool – the BODS data visualiser – which automatically creates downloadable and easy-to-understand beneficial ownership diagrams in line with the Beneficial Ownership Visualisation System.
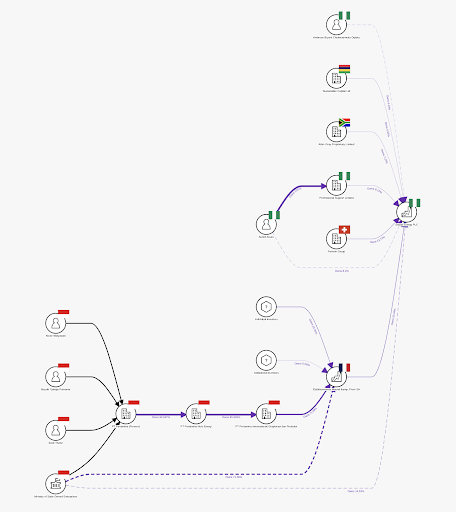
These examples demonstrate the barriers to use of public unstructured information about SOEs, and the value and utility of this information once it is available as structured data. All the steps that we took to create these visualisations can be replicated for free using our open source tooling by those studying other SOEs or any company/organisation.
Mandating for this ownership information to be released as high-quality structured data published by the SOEs themselves would improve data quality and increase its potential impact by expanding access beyond authorities.
Visit our dedicated page to learn more about Open Ownership’s open source tools or email [email protected] if you have questions or need technical support
Related articles and publications
Publication type
Blog post
Topics
Extractives,
Opening Extractives
Sections
Technology
Open Ownership Principles
Structured data
